- Research
- Open access
- Published:
A system for monitoring water quality in a large aquatic area using wireless sensor network technology
Sustainable Environment Research volume 29, Article number: 12 (2019)
Abstract
In this paper, a low cost, real-time water quality monitoring system which can be applied in remote rivers, lakes, coastal areas and other water bodies is presented. The main hardware of the system consists of off-the-shelf electrochemical sensors, a microcontroller, a wireless communication system and the customized buoy. It detects water temperature, dissolved oxygen and pH in a pre-programmed time interval. The developed prototype disseminates the gathered information in graphical and tabular formats through a customized web-based portal and preregistered mobile phones to better serve relevant end-users. To check the system effectivity, the buoy’s stability in harsh environmental conditions, system energy consumption, data transmission efficiency and web-based display of information were carefully evaluated. The experimental results prove that the system has great prospect and can be practically used for environmental monitoring by providing stakeholders with relevant and timely information for sound decision making.
Introduction
Nowadays, water is considered as one of the most scarce natural resources on our planet [1]. It is important to humankind, animals, and plants [2]. Depending on the quality of water, it may either be a source of life and good health or a source of diseases and deaths. The growing environmental degradation in recent years brought about by development, population increase and climate change increases the need for researchers to look into its negative impact in the environment, especially in water sources and its implication. Increasing water pollution in oceans, lake, and river triggers worldwide demand more advanced methods in environmental monitoring systems particularly in the field of water quality monitoring. Moreover, developing countries like the Philippines rely on the conventional methods of collecting water samples and water analysis. Due to lack of technical know-how and a huge amount in the initial investment, water analyses are usually done through conventional procedures or by using portable testers which are not only expensive and laborious but also lack the capabilities for real-time data acquisition, analyses and fast dissemination of gathered information which are crucial and essentials for effective water quality monitoring endeavour.
This Wireless Sensor Network (WSN) is suitable for monitoring physical and chemical water characteristics in remote areas at lower cost and reduce manpower requirement [3]. It can be utilized for water quality monitoring [4] which presents many advantages like its portability [5] and near real-time data acquisition and data logging capability [6]. It has gained popularity among the research community ranging from environmentalist [7] to embedded systems community [8]. However, WSN applications for the aquatic area are far more challenging activities compared to the land-based WSN applications [9] due to its electronic component which has zero tolerance to water or even moisture intrusion.
WSN-based applications for environmental monitoring have been implemented for applications such as water quality monitoring [4, 10,11,12], water chemical monitoring [8], hydrodynamic performance monitoring [9], irrigation [13], and agriculture [14]. Other studies are focused on the enhancement of the transmission, power harvesting and management and environment adaptability in the past few years of applications. Xu et al. [15] pointed out that the previous sensor network deployments mostly focused on indoor environments and simulation studies thus limiting its utilization and application, especially in real-world application.
On the other hand, Dissolved Oxygen (DO), pH, and temperature are considered as the most common water quality parameters [16] and are identified as one of the important water parameters that can be used to determine the actual physicochemical status of a certain aquatic area [17]. Measurement of how basic or acidic the water in a certain location can be done by measuring pH [18] and that makes pH as one of the most important water quality indicators. The pH parameters are difficult to measure accurately as it deals with the very small amount of ionic concentration thus need a sensitive sensing device for its detection [19]. Temperature is the most common physical assessment of water quality, as these parameters can have an effect on other parameters like photosynthesis of aquatic plants, the sensitivity of these organisms to pollution, parasites, and diseases [20]. DO is an important parameter in assessing water quality because of its influence on the organisms living in a body of water [21]. A DO level that is too high or too low can harm aquatic life and affect water quality [22].
Hence, this study will particularly cover large aquatic area monitoring, focusing on DO, pH, and temperature as water quality indicators, using WSN technologies. Also, Global System for Mobile Communication (GSM) will be used to transmit sensed data from the sink node to the base station in the same method used by Tseng et al. [23]. Our aim is to develop water quality monitoring systems deployment in order to provide a feasible solution for remote or distant places where water quality laboratory is not present. Its main advantage will be its capability for real-time monitoring. We aim to deploy a system which is reproducible, scalable and can operate independently for a long duration, and can be applied in remote areas.
Materials and methods
To design the proposed water quality monitoring system for this study, the sensors used and the system design is discussed in this section.
Sensors
The availability, affordability, and compatibility with Arduino-based architecture was the main reason for the selection of Atlas Scientific brand of water quality sensors. Atlas Scientific is an American company that has years of experience manufacturing high-performance water quality sensors which are widely used in scientific projects [24,25,26]. Temperature, pH, and DO sensors (electrodes) are connected to the microcontroller using their respective interface circuits.
System design
The system is designed and implemented with its main goal of monitoring water quality (DO, temperature, and pH) with the consideration that the system: 1) is suitable in a large aquatic area; 2) can measure and store information in a database in a real-time scenario [27]; and 3) has a mechanism system to deliver a timely notification to the managers or authorities and users of the system. The most important function of the system is to ensure that the data collected from the sensor reflects the actual aquatic scenario and the data are transmitted and delivered as a display of information in the web or as a short message service (SMS) sent to pre-identified key users in a timely manner. This is in order to provide a platform that allows fast information dissemination and quick formulation of an appropriate and immediate response. When timely report via SMS reaches the key user, for example, that user can immediately identify abrupt changes in the values of monitored water quality parameters, and thus can give them enough lead time for possible implementation of activities to minimize if not eradicate risks and damages.
Therefore, the system was designed to provide the following: 1) data collection and storage [28]; 2) data dissemination and display (charts, graphs, and datasheets) [29, 30]; 3) power management for longer measurement periods [31]; and 4) maintenance interface for administrators. The overview of the system is depicted in Fig. 1.

The network architecture
Software configuration
Figure 2 displays the systems flowchart for the operation of the proposed water quality monitoring system. Upon implementation of a node, the system will initialize the SD card and the real-time clock (RTC). It will also ready the GSM module for data transmission. After a few seconds, the system will now start collecting data thru the on-board electrodes (pH, DO and temperature). Data will be sent using GSM transceiver to the base station or the pre-identified cell phone number. Also, data will be stored in the RTC as backup data storage with the same format with the base station. In the absence of a GSM signal, data will be automatically saved to the RTC and ready to be transferred to the database located in the base station. After the transmission and data backup through the RTC, the system will automatically turn-off and wait for the 30 min time interval to conserve the energy. A separate timer circuit will awake the sensor if it reaches the required time interval of 30 min. The cycle will go on until the required tasked is achieve.
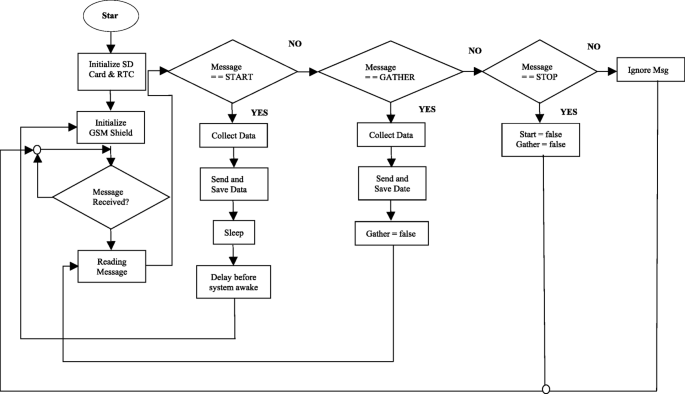
The system flowchart
The 30 min interval can be changed by the administrator in case of emergency, or there is a need to gather data between the 30 min interval through an SMS command from the server using the administrator interface. This helps to save energy for the sensor and sink node using energy from the secondary battery, thus, increasing the life of the sensor and reduce maintenance costs for battery replacement.
In the server side, it has a user-friendly interface, providing a real-time update of the sensed values for DO, temperature, and pH level. It provides graphs for easy monitoring of abnormalities in the covered area. It could also provide data sheets and pdf file for research purposes. Real-time values for the 3 parameters will also be sent using SMS into a predefined cell phone number of some concerned persons. This will give lead time to respond to the abrupt change of the 3 parameters which could be catastrophic if not responded immediately.
Wireless communication
The sensed data from the sensor node are relayed wirelessly to a sink node or directly to the server. For this study, off-the-shelf wireless transmitter and receiver module are used with the GSM module for long distance communication and ZigBee protocol for cluster (short distance) or node to node communication. ZigBee is based on the IEEE 802.15.4 standard and can reach 250 kbps data rate at a distance of 10 to 100 m. Low power consumption is the main reason for choosing Zigbee over other short distance communication systems protocol which is the main concerns for this study. The study only used the simplest ZigBee setup (sensor nodes to sink node) for less installation and operational complication. A GSM module from Arduino (Antenova- GSM Shield 2) with the integrated antenna is utilized for the sink node to connect wirelessly to the base station server or send/receive SMS. It will transmit data to the server via existing GSM networks of the local telecommunication companies (TelCos) infrastructure in the study area. This will also facilitate sending of SMS message to a predefined phone number.
Sensor node
A sensor node collects and pre-process data from the electrodes and sends data to the sink node making it as the main building block of the water quality monitoring system (WQMS) prototype. On board, the sensor nodes are commercial electrodes, microcontroller, Zigbee transceiver, and power supply. In this prototype, three sensors for measuring temperature, pH, and DO are employed to provide a general characterization of water quality but can be scaled up in terms of number of sensors if needed.
The radio frequency (RF) transceiver transmits water quality parameters (pH, DO and Temp) values, time and date to a sink node or directly to the base station. The sensors were calibrated to ensure correct operation and accuracy in the resulting water quality parameter values using the calibration solutions provided by Atlas Scientific. Arduino Mega 2560 microcontroller, an open-source electronics prototyping platform based on flexible, easy-to-use hardware and software was used to acquire and preprocess gathered data. A compact memory card is used as backup storage for all the gathered data. It uses a battery to supply power for sensors and other electronic devices within the node. Figure 3 (right image) shows the hardware architecture of a sensor node.

Left: Sink Node; Right: Sensor Node
Sink node
Sink node is basically a sensor node with the capability of sending data to long distance using GSM module as shown in Fig. 3 (left image). To save energy for its long duration operation, sink node is always set in a sleep mode while waiting for the execution of pre-programmed activities like the data gathering, reception of data from sensor nodes, sending data to the base stations and accepting command from the administrator. With a complete set of electronic components installed, sink node can be deployed in remote or distant areas since it can operate independently. It is powered by the same battery with the sensor node but must have solar power as an energy harvester due to the high power-consuming requirement of the GSM module. The presence of GSM module and the solar panel is the main difference between the sink and the sensor node in terms of physical appearance and operation.
Data storage and visualization
The system was designed to store data in three possible ways: a) in a pre-assigned cellular phone number for short period data storage; b) at the base station which houses the database and control center, and c) using an onboard Secure Digital (SD) card memory module which serves as backup storage for all individual sensor units. All data will be collated in the base station. In the case of failure of transmission or absence of GSM signal, data can be extracted from the onboard SD memory module. Gathered data on the SD card is arranged based on the date for ease of retrieval and can be open in excel format. At the base station, all data and their timestamps are stored in a database based on a multithreaded, multi-user MySQL server format. Date and time are added to the values of the water quality parameters for easy query and display in the web.
Buoy and energy systems
The design, implementation, and deployment of a WSN for water quality application pose additional problems compared with land or non-aquatic application. This is because of the impact of the moisture and water on the electronics component, thus floatation or buoy has a relevant importance in this study. The buoy is composed of a rubber tube of 750 cm in diameter and almost 250 cm in height. The side of the tube was wrapped with thin aluminium to protect from hard or pointed floating materials. The electronic equipment and battery are situated on top of the buoy in a watertight box of 15 × 15 × 10 cm dimensions.
The energy source is an important issue to consider for WQMS and the only viable method to power the sensor nodes located in remote places is to use a battery. The system implemented 6 V/3.5 amp hour (Ah) lead acid battery to power the nodes. This battery has longer life and excellent long-term and self-discharge rates. Energy harvesting system is composed of one 10 W solar panel on top of the buoy which also serves as added protection. It constantly charges the battery to preserve its energy for continuous monitoring.
Results and discussion
Construction and installation
For a successful construction and installation of a water quality monitoring system suitable for large areas, important factors like buoy stability [32], energy source and management [33], data transmission using RF transceiver [34] and sensor sensitivity and ruggedness were considered.
Buoy stability is needed to secure electronic materials and components inside the buoy as shown in Fig. 4. WQMS installed in the field through the buoy experienced an abrupt change of environment (calm to stormy weather), thus the system was designed to have stability even against adverse atmospheric conditions. Water sealed, protective painting and water resistant plyboards were used. An interior of a wheel with a plain sheet as side cover served as floatation materials. Also, anchorage system and protection to floating mechanism were introduced to withstand inclement weather in an open area. Buoy stability was tested in an open sea during an occurrence of a tropical cyclone with an estimated wind of 95 km h− 1. After 24 h of rain and strong winds, the buoy remains in its position with no major damages being detected.

The buoy
WQMS are mostly deployed in remote and hard to reach areas, and for long-time operation, therefore, it is costly to replace the sensor batteries. Also, it has high energy consumption due to the use of GSM module for long distance wireless communication system. To address the issue of the cost incurred in replacing battery, selection of high capacity battery, implementation of an energy management system and installation of an energy harvesting system using solar power systems were done on this project. A power management system wherein the system is in off-state during idle time (no activity) and on-state only during data gathering and transmission significantly increase the lifetime of batteries. Also, it implemented rechargeable batteries for possible integration of a harvesting energy system. The study employs a 6 V/3.5 Ah lead acid battery. A 10 W solar panel was installed to the sink node to address necessary additional energy.
Data transmission using radio frequency affects dramatically the system reliability. An absence, addition or discrepancy of data could have an adverse effect of data integrity and for the whole system effectivity. Moreover, data transmission must be highly reliable for the utilization of all important data of the monitoring system. An antenna-less GSM and Xbee transceiver modules were considered to address the issue of the corrosive nature of sea water and moisture from river water.
Electrodes used as sensor sensitivity and its ruggedness play an important role for a reliable WQMS. A small variation of the sensor output will change the value of sensed data and the perception about the important WQMS parameters in the area. An example of this is the value of pH, where a very small amount of signal must be detected and read by the electrochemical sensor as a very small amount of potential difference between working and reference electrode. This very small signal will be forwarded to the microcontroller for further processing. Any error or small variations will be amplified (in the interface circuit) thus affecting the value of the sensed data. For a reliable reading, the top of the line of “off-the-shelf” electrodes from Atlas Scientific were chosen and it undergoes a rigid testing and calibration using Horiba brand multi-parameter tester.
Evaluation and actual testing results
The system was deployed in two creeks, for two weeks in order to verify the buoy’s stability and effectiveness, energy source and storage, and to validate the efficiency of the wireless communication system. During this testing, the distance between the sensor node and sink node was set to 50 m, while another sink node was placed in another distant creek to test and validate the stand-alone performance of the sink node. As a result, the system was able to perform sensing of data through its pre-programmed duration of 30 min using the standby mode application with the real-time clock. Sensed data were sent through the XBee transceivers to the sink node which aggregate data from the sensor node and its own data. These datasets were sent to the base station as SMS for databasing and conversion to appropriate format for easy data display and utilization (Figs. 5 and 6). Same data will be received by some pre-determined cellular phone numbers and same values will be stored on the SD Card. After sending the data, sensors go back to the sleep mode to conserve energy of the battery forming another cycle of the system. Current consumption during on-state is approximately 550 mA and drops to 15 mA while in sleep mode. Also, the solar panel performed well during the operation by providing enough energy and achieved its maximum charge of 6 V during sunny days. With the aid of the solar panel and with the proper programming of the microcontroller for the data sensing and transmission, the sink node (with solar panel) could last months of uninterrupted operation.

The Sample SMS pH readings

Sample data webpage display
Graphical and tabular forms of data can be viewed on the website as shown in Fig. 6. This could give enough lead time for management and stakeholders to take actions to prevent accident related to significant increase or decrease of the monitored values of water quality parameter. Also, this could promote more accountability and transparency as data collected are available to all stakeholders.
Evaluation of sensor’s efficiency
The efficiency of the sensors for DO, pH, and temperatures were also evaluated by comparing its observed data values to that of a commercial multi-parameter water checker, the Horiba® probe. This is done by doing simultaneous measurements at the selected sampling points.
We show here the tabulated readings of Table 1 taken from both developed prototype and Horiba® probe, to determine the efficiency of the sensors. The water sampling results showed good results as it yielded good R2 values of the linear plots for the two datasets, readings from the developed prototype and the readings from Horiba® Water Checker.
We can observe in Fig. 7 the sensor readings for DO which yielded a better R2 value of 0.9792 compared to the pH and temperature sensor with an R2 value of 0.9731 and 0.9746, respectively. It can also be observed in Table 2 that the average difference of the values taken by the developed DO sensor, and the detected value of DO from Horiba® Water Checker is 0.006. While for pH, a 0.18 difference between the developed pH sensor and with the Horiba® Water Checker was observed.

Linear plots of DO (left), pH (right) and temperature (bottom) values taken using the developed prototyped and Horiba® probe with corresponding R-squared values
Challenges and recommendations
Some advanced countries have been using real-time WQMS to monitor their environment and water resources like the United States Geological Survey and European Innovation Partnership on Water. For developing countries, most activities for real-time WQMS are in infancy or in experimental stage. Given the experiences brought by the actual implementation, the following are some of the challenges encountered and the recommendation for the possible future enhancement of a real-time WQMS: reliability and stability of the individual sensor and the whole system; energy and its management to support long duration of deployment; cost and affordability.
Weather conditions like the constant variation of temperature and water intrusion could affect some functions of the electronic component, thus, it is very important to consider it in the design stage of the entire system. A well-designed buoy which houses all electronics component could be one the solution of this concerns. Also, utilization of antenna-less transceivers could also be one factor to consider to avoid exposure of this antenna to water and strong wind loading.
Energy source issues can be addressed through design of energy management and utilization of high capacity battery. Lithium-ion battery can increase the capacity 4 times than lead acid battery and has high number of battery life cycle. Solar power harvesting systems has been proven to be an effective energy harvesting mechanism and its fast charging capability would be a good fit to lithium-ion battery which has characteristics and capability for high charging rate.
Cost and affordability are one of the main problems for a widespread implementation of automated WQMS in developing countries. Costing of such unfamiliar technology is misleading especially in places where water quality monitoring is seldom conducted or not required at all. Perception must be changed and corrected through government institution, concerned private entity and research community in that water quality monitoring must be done regularly and efficiently. Standard sampling frequency/interval and methods of water quality monitoring will highlight a higher cost of doing manual monitoring (cost of laboratory equipment, wages of highly skilled personnel, and cost of transportation) against much less expensive automation and could change perception regarding the cost and benefit of doing automated monitoring. Also, the following could further reduce the cost of automated WQMS: utilization of local materials (materials for buoy system), tapping local researcher to assemble their own automated WQMS and using the latest technology like lithium-ion battery and more efficient type of solar panels.
Conclusions
In this study, a low-cost water quality monitoring system has been developed which is applicable to a large area of coverage. Its applicability was attributed to its long duration operation, flexibility, and reproducibility. It utilized commercially available electrochemical sensors to monitor water quality parameters accurately and display the result in the web using WSN and GSM technology. These sensors were tested alongside with standard laboratory setup and Horiba® handheld multi-tester and results yielded quality results. It can display real-time results through web thus giving enough information regarding the real scenario of water quality in the covered areas.
Expansion of the coverage area for this system using autonomous surface vehicle is ongoing to cover large areas like lakes and other bodies of water which need constant monitoring due to its importance both to humankind and nature. Utilization of lithium-ion battery for its energy source and the addition of heavy metals ion as parameters of interest is also considered for the expansion of the study.
References
Bakker K. Water security: research challenges and opportunities. Science. 2012;337:914–5.
Storey MV, van der Gaag B, Burns BP. Advances in on-line drinking water quality monitoring and early warning systems. Water Res. 2011;45:741–7.
De Marziani C, Alcoleas R, Colombo F, Costa N, Pujana F, Colombo A, et al. A low cost reconfigurable sensor network for coastal monitoring. In: OCEANS 2011 IEEE. Santander; 2011 Jun 6-9.
Chung WY, Yoo JH. Remote water quality monitoring in wide area. Sensor Actuat B Chem. 2015;217:51–7.
Rashid B, Rehmani MH. Applications of wireless sensor networks for urban areas: a survey. J Netw Comput Appl. 2016;60:192–219.
Can Z, Demirbas M. Smartphone-based data collection from wireless sensor networks in an urban environment. J Netw Comput Appl. 2015;58:208–16.
Bromage M, Obraczka K, Potts D. SEA-LABS : a wireless sensor network for sustained monitoring of coral reefs. In: Akyildiz IF, Sivakumar R, Ekici E, Oliveira JC, McNair J, editors. NETWORKING 2007. Ad hoc and sensor networks, wireless networks, next generation internet. Berlin and Heidelberg: Springer; 2007. p. 1132–5.
Hayes J, Beirne S, Lau KT, Diamond D. Evaluation of a low cost wireless chemical sensor network for environmental monitoring. In: IEEE SENSORS 2008. Lecce; 2008 Oct 26-29.
Perez CA, Jimenez M, Soto F, Torres R, Lopez JA, Iborra A. A system for monitoring marine environments based on wireless sensor networks. In: OCEANS 2011 IEEE. Santander; 2011 Jun 6-9.
Alippi C, Camplani R, Galperti C, Roveri M. A robust, adaptive, solar-powered WSN framework for aquatic environmental monitoring. IEEE Sensors J. 2011;11:45–55.
Kumar RK, Mohan M, Vengateshapandiyan S, Kumar MM, Eswaran R. Solar based advanced water quality monitoring system using wireless sensor network. Int J Sci Eng Technol Res. 2014;3:385–9.
Faustine A, Mvuma AN, Mongi HJ, Gabriel MC, Tenge AJ, Kucel SB. Wireless sensor networks for water quality monitoring and control within Lake Victoria Basin: prototype development. Wirel Sens Netw. 2014;6:281–90.
Dinh TL, Hu W, Sikka P, Corke P, Overs L, Brosnan S. Design and deployment of a remote robust sensor network: experiences from an outdoor water quality monitoring network. In: 32nd IEEE Conference on Local Computer Networks. Dublin; 2007 Oct 15-18.
Kotamaki N, Thessler S, Koskiaho J, Hannukkala AO, Huitu H, Huttula T, et al. Wireless in-situ sensor network for agriculture and water monitoring on a river basin scale in southern Finland: evaluation from a data user's perspective. Sensors Basel. 2009;9:2862–83.
Xu GB, Shen WM, Wang XB. Applications of wireless sensor networks in marine environment monitoring: a survey. Sensors Basel. 2014;14:16932–54.
Chapman D, editor. Water quality assessment - a guide to use of biota, sediments and water in environmental monitoring. 2nd ed. London: E&FN Spon; 1996.
Shah KA, Joshi GS. Evaluation of water quality index for river Sabarmati, Gujarat, India. Appl Water Sci. 2017;7:1349–58.
Kumar M, Puri A. A review of permissible limits of drinking water. Indian J Occup Environ Med. 2012;16:40–4.
Qin YH, Kwon HJ, Howlader MMR, Deen MJ. Microfabricated electrochemical pH and free chlorine sensors for water quality monitoring: recent advances and research challenges. RSC Adv. 2015;5:69086–109.
Chang HJ. Spatial and temporal variations of water quality in the Han River and its tributaries, Seoul, Korea, 1993−2002. Water Air Soil Poll. 2005;161:267–84.
Rasin Z, Abdullah MR. Water quality monitoring system using Zigbee based wireless sensor network. Int J Eng Technol. 2009;9:24–8.
Mulholland PJ, Houser JN, Maloney KO. Stream diurnal dissolved oxygen profiles as indicators of in-stream metabolism and disturbance effects: fort Benning as a case study. Ecol Indic. 2005;5:243–52.
Tseng CL, Jiang JA, Lee RG, Lu FM, Ouyang CS, Chen YS, et al. Feasibility study on application of GSM-SMS technology to field data acquisition. Comput Electron Agr. 2006;53:45–59.
Rao AS, Marshall S, Gubbi J, Palaniswami M, Sinnott R, Pettigrovet V. Design of low-cost autonomous water quality monitoring system. In: 2013 International Conference on Advances in Computing, Communications and Informatics. Mysore; 2013 Aug 22-25.
Siyang S, Kerdcharoen T. Development of unmanned surface vehicle for smart water quality inspector. In: 2016 13th International Conference on Electrical Engineering/Electronics, Computer, Telecommunications and Information Technology. Chiang Mai; 2016 Jun 28-Jul 1.
Lambrou TP, Anastasiou CC, Panayiotou CG, Polycarpou MM. A low-cost sensor network for real-time monitoring and contamination detection in drinking water distribution systems. IEEE Sensors J. 2014;14:2765–72.
Siregar B, Menen K, Efendi S, Andayani U, Fahmi F. Monitoring quality standard of waste water using wireless sensor network technology for smart environment. In: 2017 International Conference on ICT for Smart Society. Tangerang; 2017 Sept 18-19.
López M, Gómez JM, Sabater J, Herms A. IEEE 802.15.4 based wireless monitoring of pH and temperature in a fish farm. In: 2010 15th IEEE Mediterranean Electrotechnical Conference. Valletta; 2010 Apr 26-28.
Randhawa S, Sandha SS, Srivastava B. A multi-sensor process for in-situ monitoring of water pollution in rivers or lakes for high-resolution quantitative and qualitative water quality data. In: 2016 IEEE International Conference on Computational Science and Engineering and IEEE International Conference on Embedded and Ubiquitous Computing and 15th International Symposium on Distributed Computing and Applications for Business Engineering. Paris; 2016 Aug 24-26.
Roadknight C, Parrott L, Boyd N, Marshall IW. A layered approach to in situ data management on a wireless sensor network. In: 2004 Intelligent Sensors, Sensor Networks and Information Processing Conference. Melbourne; 2004 Dec 14-17.
Gao H, Chen Q, Yang Q. Power management system for microbial fuel cell powered water quality monitoring system. In: 2015 IEEE 16th Workshop on Control and Modeling for Power Electronics. Vancouver; 2015 Jul 12-15.
Vesecky JF, Laws K, Petersen SI, Bazeghi C, Wiberg D. Prototype autonomous mini-buoy for use in a wireless networked, ocean surface sensor array. In: 2007 IEEE International Geoscience and Remote Sensing Symposium. Barcelona; 2007 Jul 23-28.
Yue R, Ying T. A novel water quality monitoring system based on solar power supply & wireless sensor network. Procedia Environ Sci. 2012;12:265–72.
Macias E, Suarez A, Chiti F, Sacco A, Fantacci R. A hierarchical communication architecture for oceanic surveillance applications. Sensors Basel. 2011;11:11343–56.
Acknowledgments
Our thanks to the scholarship funding given by the Department of Science and Technology through its Engineering Research and Development for Technology (ERDT) Program. We are also grateful for the provision of laboratory space and equipment by the Center for Robotics, Automation and Fabrication Technologies (CRAFT) of Caraga State University.
Author information
Authors and Affiliations
Contributions
AD carried out the sensor prototyping and drafted the manuscript. MJ carried out the sensor implementation and conducted the statistical analysis. ET participated in the design of the study, proofread and finalization of the manuscript. All authors read and approved the final manuscript.
Corresponding author
Ethics declarations
Competing interests
The authors declare that they have no competing interests.
Publisher’s Note
Springer Nature remains neutral with regard to jurisdictional claims in published maps and institutional affiliations.
Rights and permissions
Open Access This article is distributed under the terms of the Creative Commons Attribution 4.0 International License (http://creativecommons.org/licenses/by/4.0/), which permits unrestricted use, distribution, and reproduction in any medium, provided you give appropriate credit to the original author(s) and the source, provide a link to the Creative Commons license, and indicate if changes were made. The Creative Commons Public Domain Dedication waiver (http://creativecommons.org/publicdomain/zero/1.0/) applies to the data made available in this article, unless otherwise stated.
About this article

Cite this article
Demetillo, A.T., Japitana, M.V. & Taboada, E.B. A system for monitoring water quality in a large aquatic area using wireless sensor network technology. Sustain Environ Res 29, 12 (2019). https://doi.org/10.1186/s42834-019-0009-4
Received:
Accepted:
Published:
DOI: https://doi.org/10.1186/s42834-019-0009-4